ALBA Synchrotron

A group of researchers from Universitat Politècnica de Catalunya (Trinitat Pradell and Gloria Molina) and from Universitat de Vic (Joaquim Pla and Judit Molera) have measured in ALBA different decorations in glass and glazed ceramics from the historical periods of early Islamic glazes and late Renaissance. The aim of this research is to determine the differences in materials and technology in the periods and regions analyzed.
This group focused their research on the micro-and nano-crystalline compounds responsible for the colors and decorations in historic glass and glazed ceramics. The nature of these decorations depends on the procedures followed to obtain them. Two main sets of historic materials were studied: decorated stained glass fragments from various periods and cathedrals in Spain (14th to 16th AD) to discover materials and methods used and early opaque Islamic glazes from Syria and Egypt (7th and 8th AD) to identify the connection with opaque glass technology.
In this project, measurements were performed in two different ALBA beamlines. The focusing capability, high brilliance of the micro-XRD setup at beamline 04-MSPD allows researchers to identify the crystalline compounds of samples.
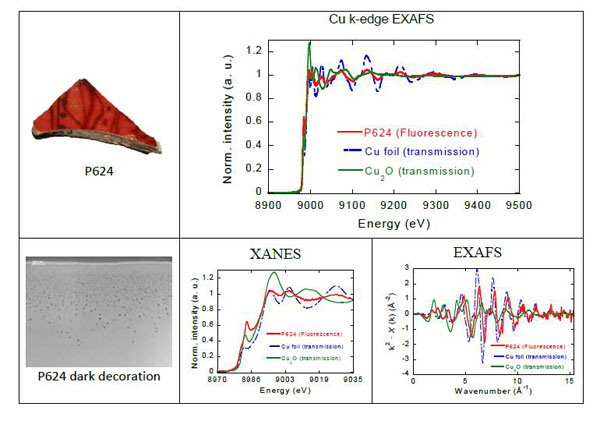
They also investigated at beamline 22-CLAESS copper speciation in polychrome Islamic lustre decorations from the earliest production (Iraq 9th century AD) belonging to the Ashmolean Museum (Oxford, UK); in particular, those showing silver-golden and red-coppery decorations. Both metallic silver (5-20 nm) and copper (10-70 nm) nanoparticles are present respectively, copper may also happen as Cu2+, Cu+ dissolved or forming Cu2O nanoparticles in the glass giving different color and shine to the lustre layers.

Fig. 1: The figure shows the identification of the crystalline compounds in the 15th century "plaqué" red glass; a red layer of 100 µm applied between two transparent glasses. Although the crystalline compounds are present in very small amounts as can be seen in the CCD image of the detector, metallic copper particles, Cuº, and Cu2S are clearly identified.

Fig. 2: A characteristic fluorescence spectrum of Cu, 200x200 µm2 area corresponding to the black decoration, is shown. The data is compared to the Cuº foil and Cu2O standards measured in transmission. The reduced intensity of the spectrum is related to the small size of the metallic copper nanoparticles, Cu+ is also observed, most of it dissolved in the glassy matrix; full analysis of the data will also determine or withdrawn the presence of cuprite nanoparticles.