ALBA Synchrotron

Researchers from CNB-CSIC, using data collected in MISTRAL and BESSY II (Germany), have discovered that T cells are able to capture and kill bacteria from dendritic cells by transinfection.
During infections, several bacterial species escape from the immune system because infecting and using as a vehicle key cells for pathogens recognition: the antigen presenting cells (APC). In previous studies with mice it has been proposed that T cells could also serve as bacterial reservoir. However, taken into account that primary T cells are infected poorly in vitro, the route bacteria invade T cells remains unknown.
Using synchrotron light of MISTRAL beamline (in ALBA) and BESSY II (Germany), it has been discovered that T cells are able to capture bacteria from dendritic cells (DC) by transinfection and kill the transinfected bacteria. These striking results show that T cells, the paradigm of adaptive immunity, have developed functions thought to be exclusive to cells of the innate immunity system.
By analyzing in the laboratory at the Instituto de Investigación Sanitaria Princesa (Hospital de Santa Cristina) the differences between the T cells, it was observed that when these lymphocytes are transinfected with bacteria, they produce more inflammatory cytokines (i.e., IL-6, TNF-alpha and IFN-gamma) than non-infected cells and protect from bacterial infections in vivo.
Reference: T cells kill bacteria captured by transinfection from dendritic cells and confer protection in mice. Cruz-Adalia A, Ramirez-Santiago G, Calabia-Linares C, Torres-Torresano M, Feo L, Galán-Díez M, Fernández-Ruiz E, Pereiro E, Guttmann P, Chiappi M, Schneider G,Carrascosa JL, Chichón FJ, Martínez del Hoyo G, Sánchez-Madrid F, Veiga E. Cell Host Microbe (2014) 15: 611-622
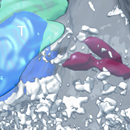
In the figure below: A) Virtual slice of a tomogram showing an infected dendritic cell (DC) exposing internal bacteria near the immune synapse (IS) with a T cell (T). N labels the nucleus position of the T cell and V some vesicles. Bacteria are visible in the dashed orange square. B) Consecutive virtual slices every 460 nm showing the proximity of the three bacteria, in the orange square of A, to the IS with a T cell. Scale bars in A and B represent 2 microns. C, D and E) Volumetric representations of the tomogram in A and B. The T cell is represented in cyan and its nucleus is shown in blue. The dendritic cells (DC) are shown in grey and the bacteria in red.